Czapp Opinion Focus
India is the world’s largest sugar consumer. However, per capita sugar consumption is low by global standards. Per capita sugar consumption is now also falling; we find out why.
The Indian Conundrum
India is a major player in the global sugar market. The country is one of the world’s biggest sugar producers and is the largest sugar consumer globally in absolute terms.
Indian Sugar Consumption by Year
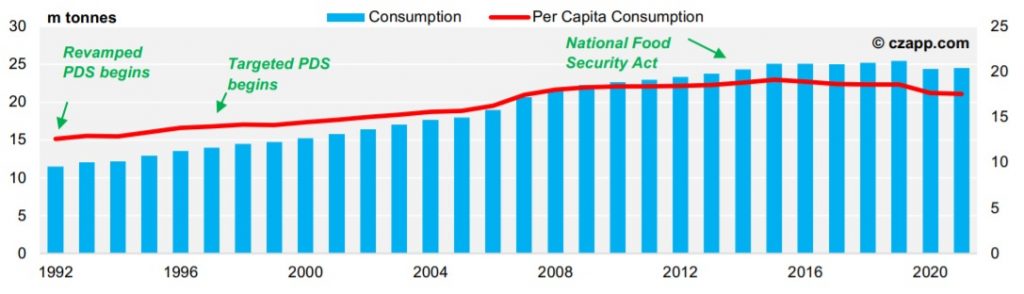
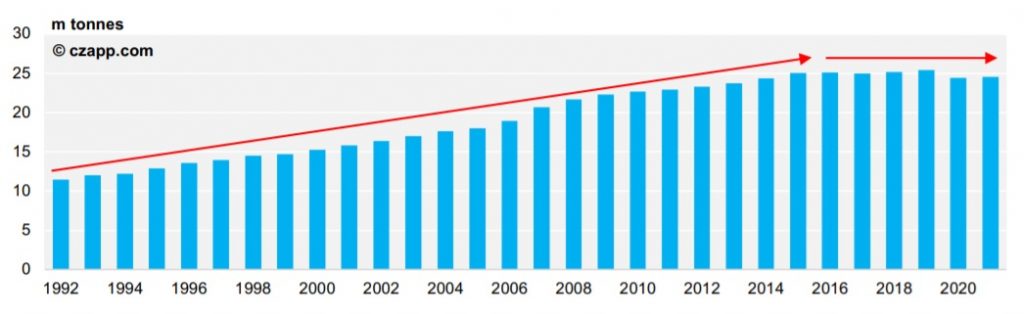 But in per capita terms, the country’s consumption is relatively low. After a gradual increase from around 12kg between 1992, it appears consumption began to plateau in around 2008.
India’s Per Capita Sugar Consumption
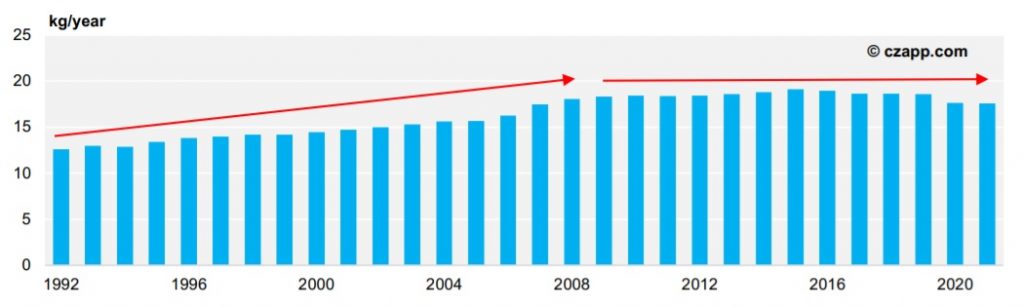
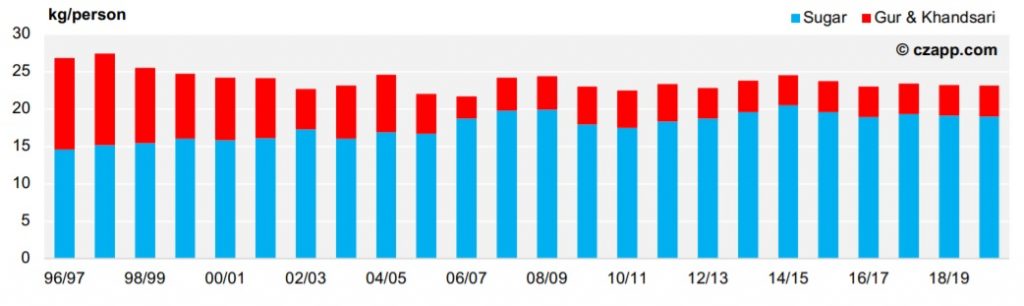
Since then, India has consumed about 19kg per person per year. As a region, Asia’s per capita sugar consumption of around 18kg per year is below the global average of about 22kg, although certain countries, such as Thailand, have very high levels of around 38kg. Sugar consumption in India works slightly differently to other countries in that ‘artisan’ sweeteners such as gur and khandsari (hereafter referred to solely as ‘gur’ for ease), made from evaporated cane juice, have been extremely popular and constituted a large proportion of sugar intake. When including these sweeteners, the peak of sugar consumption comes much earlier, around the late 1990s. This can be seen in a longer-term data series collected by the Indian Council of Agricultural Research.
Indian Per Capita Sugar and Gur Consumption
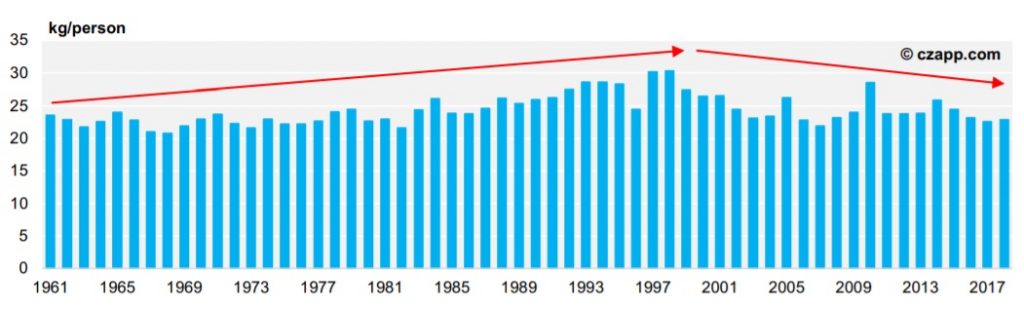
However, including gur does at least mean that India’s sweetener consumption has peaked closer to levels seen in many other nations around the world near 30kg/person/year. India’s overall sweetener consumption is therefore in decline on a per capita basis, but this effect is being partially hidden as sugar is taking market share from artisan sweeteners.
India’s Sugar Consumption Split
Why is Indian per capita sugar consumption falling from such a low level? Here are some ideas.
The Link Between Sugar and Income
One possible explanation for the lower peak in sugar consumption is the size of the economies. While Thailand, Mexico and Brazil all have relatively similar per capita GDPs in the $6,000 to $9,000 range, India’s is far lower. India’s per capita income in 2021 was $2,191, ranking it in 145th position of the 195 countries and territories on which the World Bank gathered data.
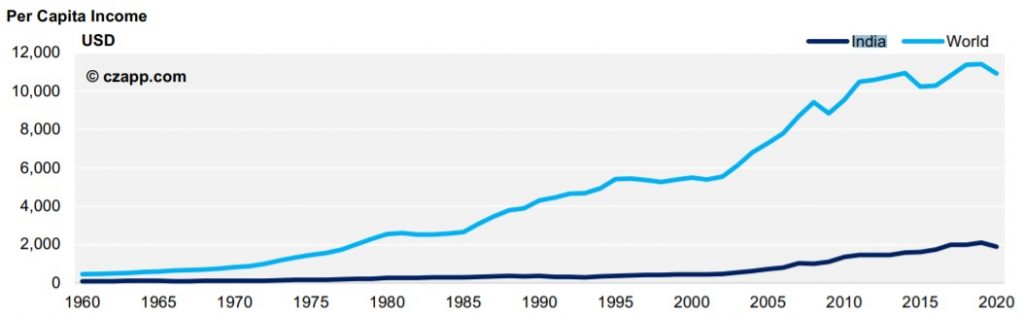
Income greatly influences sugar consumption. Consumption tends to increase with income as higher disposable income generates greater ability to buy foods which are eaten for pleasure and not just for sustenance, and ultimately enables people to eat pre-prepared foods. Until very recently, India’s increase in sugar consumption has trended in line with the rise in disposable income.
India’s Sugar Consumption and GDP
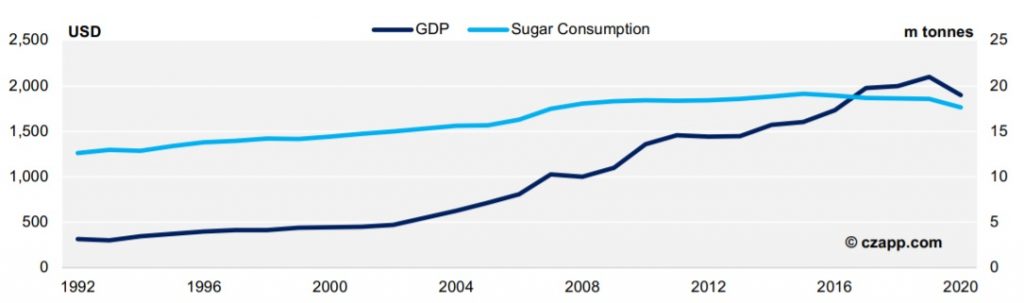
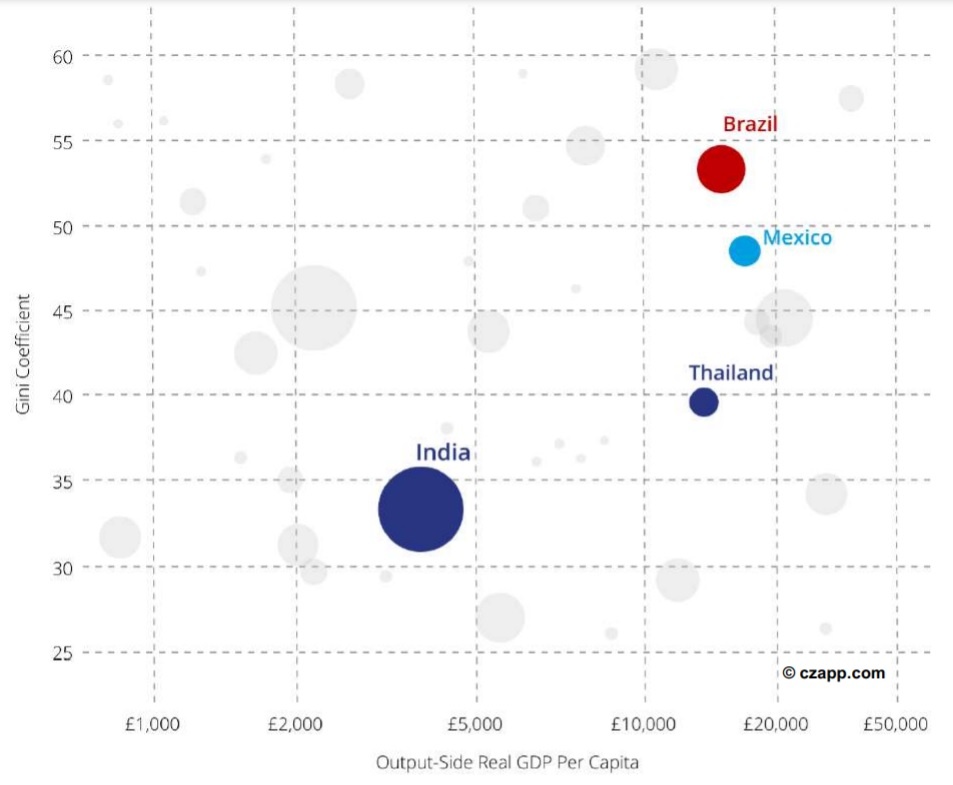
But sugar consumption has not risen quite as quickly as GDP. At first glance, this could be explained by income inequality, but India, in fact, has less income inequality than the comparable countries when calculated with the Gini coefficient.
GDP Per Capita vs. Economic Inequality
That being said, we know sweetener consumption is much higher across higher income brackets in India. Across lower income brackets, consumption is far lower than recommendations.
All Sweetener Daily Calorie Intake Per Capita
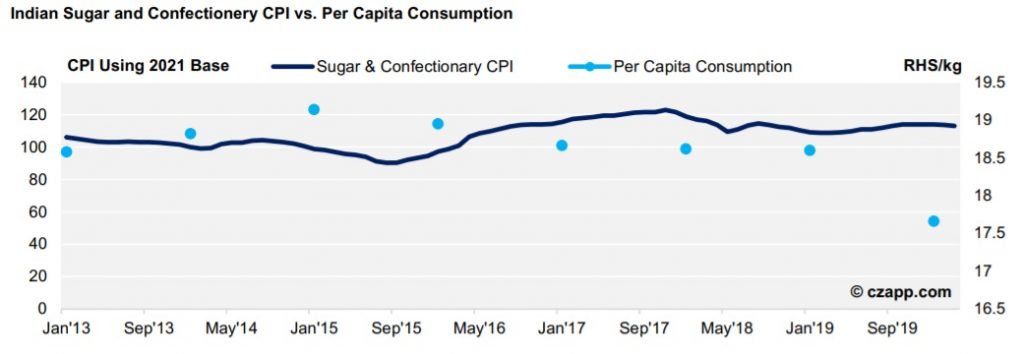
CPI data also indicates that consumption behaviours change with affordability. As the sugar and confectionary CPI rose in the period from 2013 to 2019, consumption dipped, and vice versa. In 2020, consumption likely dropped by so much due partially to the effects of COVID19, rather than economic factors.
Indian Sugar and Confectionery CPI vs. Per Capita Consumption
Slow Urbanization
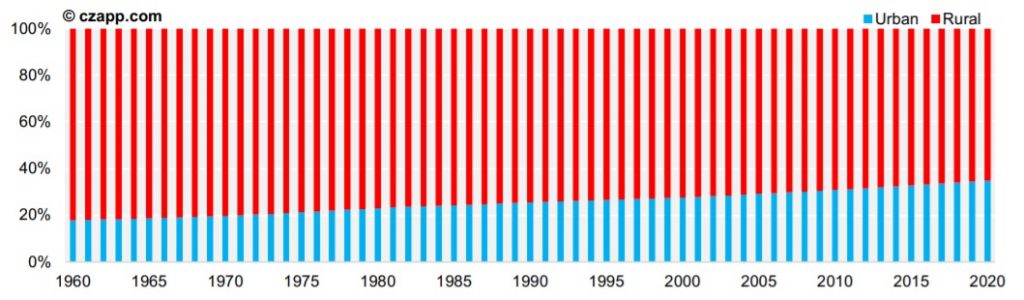
Generally, urbanization generates greater sugar consumption due to an increase in access to processed and convenience food. In India, the urban population has been growing but remains relatively low.
India’s Population
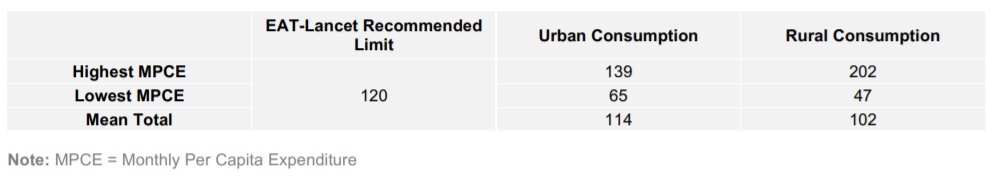
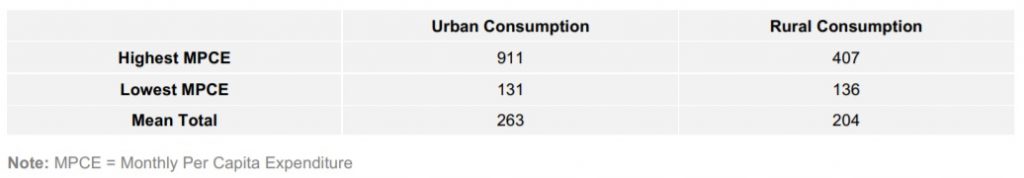
It’s unlikely urbanization will continue in India, at least not very quickly. According to the Observer Research Foundation, although many cities are willing to spend money creating new infrastructure assets, they’re far more hesitant to make allocations to maintenance, presenting a roadblock for urban development. But in India, there doesn’t seem to be significantly greater consumption of processed foods in urban settings than in rural areas, except among the highest monthly per capita spenders.
Processed Foods Daily Calorie Intake Per Capita
This indicates that, even if there were a huge shift to urban living, there would not be an accompanying boost in consumption of processed foods unless it were perhaps accompanied by a significant increase in disposable income.
Public Distribution System
Another factor we considered was to look at the way the Indian government provides food support to the poorest parts of the population. With a large population living below the poverty line, India’s government instituted a Public Distribution System (PDS) to distribute food to those lower-income households in the 1960s. Poverty is still a massive issue in India, with Pew Research Center estimating in 2020 that those living on less than USD 2 per day was at about 134 million.
The PDS has undergone changes through the years. Prior to 2013, the Government required sugar mills to sell 10% of their production to the PDS system at a discounted rate. When this system was succeeded by the National Food Security Act, it was replaced by a 18.50 Rs/kg government subsidy covering all below the poverty line, and later only the poorest of the poor population, or Antyodaya Anna Yojana (AAY). Each eligible family is currently entitled to 1kg of sugar per month. There’s estimated to be around 25 million AAY families and each has on average 3.88 members. When controlling for these 90 million people as well as the estimated 23,195 tonnes of sugar allocated to them, per capita sugar consumption across the rest of the population does increase, but only marginally.
The previous PDS saw the Government procure sugar to allocate to those eligible, although amounts set aside were marginal at about 200k to 250k tonnes per year. The use of ration cards in some form since the 1960s may have artificially lowered per capita sugar consumption slightly, although the impact has been minimal. Also, as the PDS underwent changes, including when sugar allocations were limited to the AAY families in 2012, consumption patterns went largely unchanged. This indicates that the PDS had very little impact on consumption data.
India’s Absolute and Per Capita Sugar Consumption
The Indian Diet
It’s interesting to consider that the average Indian diet is actually quite close to those recommended by many health authorities. The current Indian diet is heavy in grains, of which there’s also an excess in production. In both rural and urban areas, Indians exceed recommendations for whole grain and starchy vegetable intake, but this phenomenon is more pronounced in rural areas, according to a study published in the Lancet. Typical staples of the Indian diet include rice and flour, which are plentiful, affordable, and filling. In fact, these staples make up a staggering 65-70% of the daily caloric intake among lower income populations, outstripping recommended levels of 32%.
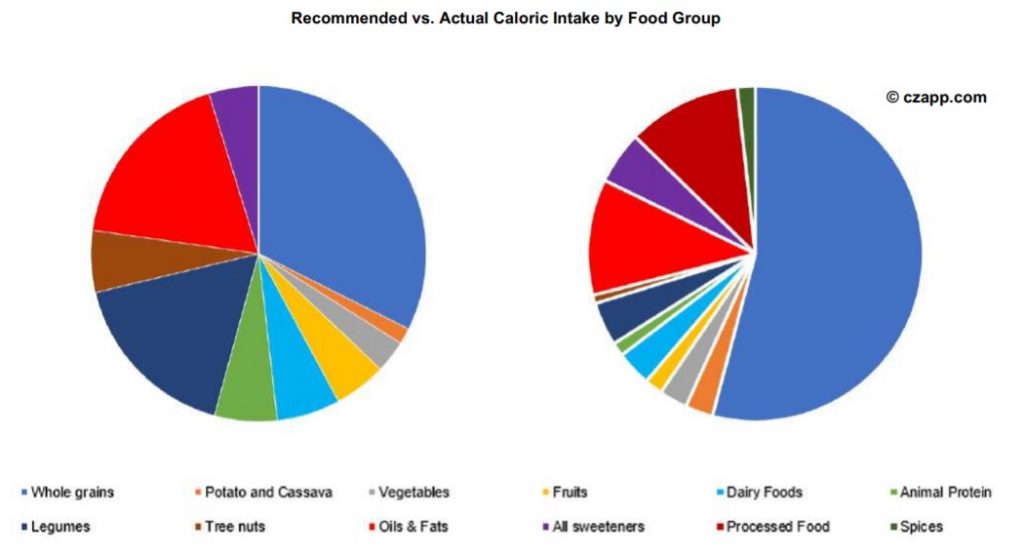
Aside from the high consumption of grains, the Indian diet seems to closely resemble the ideal diet promoted by many health authorities: it is high in whole grains and starchy vegetables, with moderate meat, dairy, fruit and vegetable intake and sugar intake that is in line with recommendations. Despite this, India ranks second in the world in terms of its number of diabetic patients. It has a rate of diabetes that is in line with economies such as the US and Germany, where citizens have about 33 times and 24 times greater spending power, respectively. We find this strange, but it’s probably one of the reasons the Indian government has taken steps to reduce sugar consumption, which doesn’t bode well for reversing the decline that’s already happening.
Front of Package Labelling Regulations
Before now, low per capita consumption means the Government hasn’t really had to make any efforts to restrict access to sugar. In fact, the focus has primarily been the opposite – on guaranteeing sugar access to prevent malnutrition. But a recent increase in consumption of processed foods has prompted India’s Food Safety and Standards Authority (FSSAI) to move forward with draft regulations on front of packaging labels. According to FSSAI, per capita sales of ultra-processed food rose to about 6kg in 2019 from 2kg in 2005. The number is projected to grow to about 8kg by 2024. Similarly, ultra-processed beverage sales rose to 6.5 litres from 2 litres in the same period. Further growth of 3.5 litres is expected by 2024.
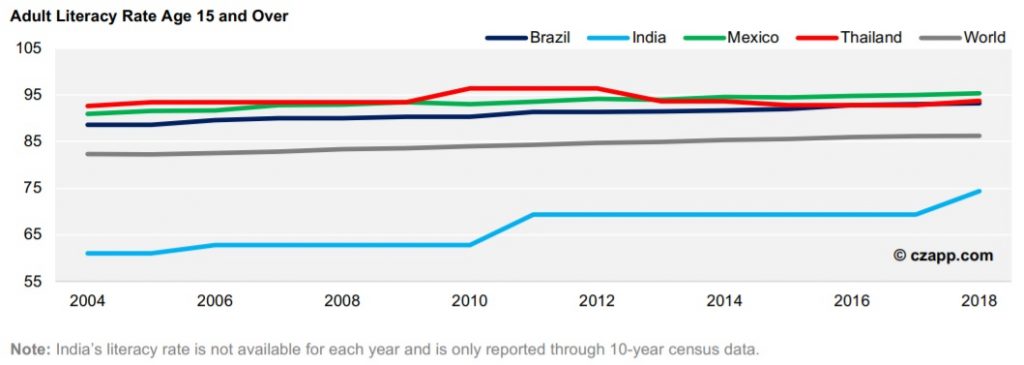
The FOPL efforts have been delayed by lack of consensus over the limits that should be imposed on the labels. For consumer groups, the labels should contain values of salt, sugar and far for each 100g or 100ml serving, which they say would make the labels easier to understand. The food industry has pushed back, suggesting that information about positive nutrients is also contained on the labels but this was rejected by FSSAI. There’s also disagreement over the daily upper limit on total sugar and added sugar. FSSAI proposed that total sugar be capped at 50g and the National Institute of Nutrition, Hyderabad suggests a 25g to 30g cap on added sugar. But industry wants a 90g cap on total sugar, citing guidelines in certain high-income countries. Experts and industry insiders have also debated over the most easily understandable format for the labels. In India, the estimated current literacy rate stands at about 77%, far below that of other economies that have successfully implemented FOPL.
This means labels on food must be understandable in India beyond words. Options include traffic light signs, nutrition scores, health star ratings and warning symbols. The Indian Institutes of Management (IIM) is currently conducting a survey on which type of label would be most understandable. And while most sugar consumed in India is used in industrial production, about one third is tabletop consumption. India has a variety of sweetmeat vendors, restaurants, canteens, tea and coffee shops and roadside juice centres. According to the US Department of Agriculture, domestic consumption remained high during the pandemic and like in many other places, there was a shift to online food deliveries.
Unless these small businesses are targeted – a mammoth task – FOPL would not apply to about 8m tonnes of sugar in the Indian diet.
Further Policy Efforts
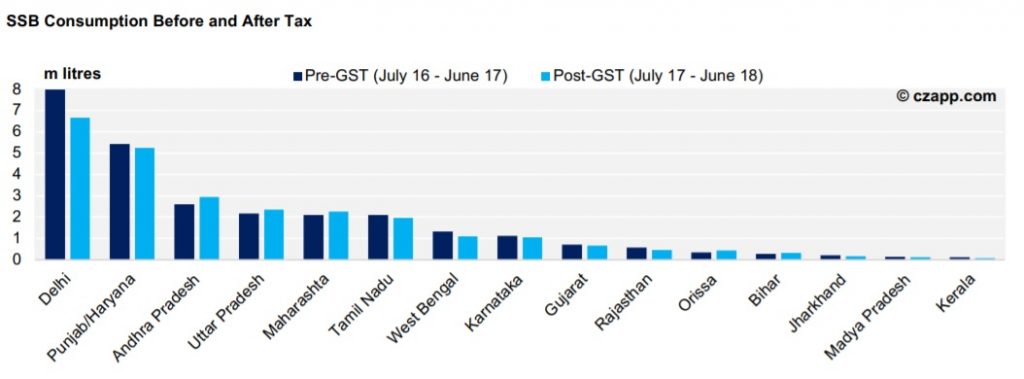
There have been some other policy efforts made by the Government to curb sugar consumption, but these have been limited to a sugar sweetened beverage (SSB) tax. India imposed SSB taxes in the form of a Goods and Service Tax (GST) of between 5% and 28% in 2017. But prior to this, the purchase of SSBs for at-home consumption was relatively low, at about 1.1 litre per capita. The fact the Government did not impose this tax primarily as a health policy meant it was not accompanied by an educational campaign. As a result, very few people were even aware of the existence of the tax. A 2020 study found that three quarters of participants were unaware that the taxes existed. Of those who were aware of the taxes, fewer than half knew the correct rates of the tax. The researchers in the study concluded that no evidence was found of a decline in the purchase of aerated drinks following the tax, one of the explanations for which was the limited effect on public awareness.
We’ve seen that some sugar taxes can be effective, while others are less so. Flat taxes, as has been seen in Mexico, at best tend to only provide short term reductions in consumption. And it’s difficult for taxes alone to change consumer behaviour, so often it’s educational campaigns that accompany taxes that generate the most compelling results. In India, it seems the only educational campaign has been focused on promoting sugar consumption as part of a healthy diet. Last year, the Indian Sugar Mills Association (ISMA) launched a Sugar and Health campaign to promote sugar consumption as an affordable, healthy part of the Indian diet.
Growing Digital Penetration
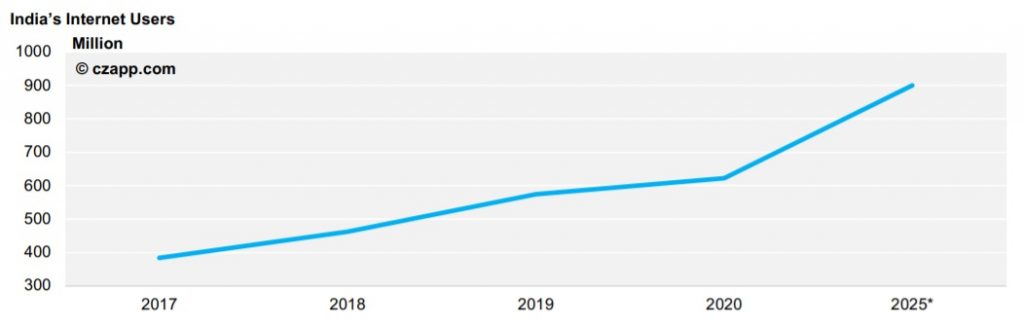
Between 2014 and 2017, India leapt 58 points in McKinsey’s Country Digital Adoption Index to obtain 90 points out of a possible 100. As of 2020, there are about 622 million internet users in India and this figure is expected to rise significantly to over 900 million by 2025 – covering about 65% of the population.
We know increased awareness of sugar intake is one of the most compelling reasons why sugar consumption dips, and with much more awareness of the health implications of excessive sugar consumption, it’s possible this could play a role in its continued stagnation. If awareness of the implications of sugar increases, it seems likely that the plateau in per capita consumption is around current levels, meaning India has a very different profile than other countries we have examined.
Is India Sweet Enough?
Sugar has a place in Indian cultural events, festivals and gift giving. It’s hard to see how Indian per capita sugar consumption drops significantly below current levels given that its consumption is already so low relative to other countries. But it’s difficult to see a convincing argument that it could increase either. Even if population growth has increased sugar consumption on an absolute basis in the last 20 years, there seems to be a waning appetite for the commodity in India and individual diets are less sweet than they were 20 years ago. Given efforts made by the Government to impose taxes and front of packaging labelling, alongside other policies that prioritize ethanol production, it’s also hard to see how per capita sugar consumption increases in the short to medium term. Further urbanisation in India offers the best hope for increased processed food intake boosting sugar consumption, but this is likely to be a multi-decade process. We think it’s unlikely India will ever reach the 40 kg per person peak sugar consumption seen in many other countries; this is an assumption that has been widespread in the sugar industry for years. A gap of about 20kg per person in a country of 1.38 billion people has significant effects on the global sugar market – to the tune of about 27.6m tonnes per year.
For more articles, insight and price information on all things related related to food and beverages visit Czapp.